In Surface Substitution on 36 Plates 1972 (Tate T06637), Jennifer Bartlett experiments playfully with a sequence of numbers, visualising the growth of that sequence in a way that incorporates both the strict structure of a coordinate system and the freedom and unpredictability of randomness. Bartlett’s work is mathematically significant in her use of a recursive sequence, her algorithmic approach to the production of the piece, and especially in her visualisation of numbers and the relationships between them – a practice that has had a long and significant history in moving mathematics forward.
The Fibonacci sequence and series
The particular number sequence used in Surface Substitution is the Fibonacci sequence. The sequence was first described by Leonardo of Pisa (1175–1250), also known as Fibonacci, a merchant who changed the course of civilisation by introducing the Western world to the Hindu-Arabic number system.1 His book Liber Abaci, first published in 1202, begins with the words:
The nine Indian Figures are: 9 8 7 6 5 4 3 2 1.
With these nine figures, and with the sign 0 which the Arabs call zephyr, any number whatsoever is written, as demonstrated below.2
According to mathematicians Alfred Posamentier and Ingmar Lehmann, ‘this catapulted the discipline of mathematics forward’ because the creation of efficient algorithms for performing mathematics was not possible using the cumbersome symbols of the time, such as Roman numerals.3
Liber Abaci contained numerous algebraic problems and interesting mathematical curiosities, including the Fibonacci numbers. In the Fibonacci sequence (1, 1, 2, 3, 5, 8, 13, 21, 34…) each successive term is generated by adding the two previous terms, such that:
1 + 1 = 2
1 + 2 = 3
2 + 3 = 5
3 + 5 = 8
5 + 8 = 13, and so on.
In the language of mathematics, a formal definition of the Fibonacci sequence would be as follows (with translation in parentheses):
F1 = 1 (the first number is 1)
F2 = 1 (the second number is 1)
Fn = Fn-1 + Fn-2 for n > 2 (the nth number is the sum of the two preceding numbers)
Fibonacci wrote about the sequence in Liber Abaci as the pattern produced by reproducing pairs of rabbits.4 The sequence was reintroduced and renamed by French mathematician Edouard Lucas (1842–1891), who adapted the Fibonacci pattern to invent a new sequence of numbers called the Lucas numbers, which used 1 and 3 rather than 1 and 1 as the starting numbers (1, 3, 4, 7, 11, 18, 29, 47, 76, and so on). Since that time, Fibonacci numbers have been found widely in nature, including in the number of spirals in pineapples, pinecones and various types of flowers, in leaf arrangements, in the number of petals of certain flowers, and in the reproductive patterns of other animals besides rabbits.
One of the most interesting properties of the sequence is that the ratio of each successive pair of numbers in the Fibonacci sequence gets closer and closer to the golden ratio.5 The golden ratio, also known as phi, was first described in around 300 BC by the mathematician and philosopher Euclid, who produced the number through a specific geometric construction. The golden ratio has been used by artists and architects, and has often been praised as the most pleasing and natural proportion.6 The golden ratio is often written approximately as the fraction ⁵⁄₃, but phi is an irrational number – one that cannot be accurately expressed as a fraction and has an infinite decimal representation. In other words, the exact number phi is actually inherently unknowable. By using ratios of Fibonacci numbers, however, we can get closer and closer (but never reach) the true decimal representation of phi. Members of the Fibonacci Association continue to explore the properties of the Fibonacci numbers.7
A Fibonacci series, as opposed to a sequence, is made up of the sums of the first n Fibonacci numbers. For example, the sum of the first 6 Fibonacci numbers is
1 + 1 + 2 + 3 + 5 + 8 = 20
and the sum of the first 10 Fibonacci numbers is
1 + 1 + 2 + 3 + 5 + 8 + 13 + 21 + 34 + 55 = 143.
Therefore the sixth and tenth numbers in the Fibonacci series are 20 and 143, with the series running as follows: 1, 2, 4, 7, 12, 20, 33, 54, 88, 143, and so on.
Bartlett’s visualisation of the Fibonacci series
In her accompanying notes to Surface Substitution Bartlett specifies that she is using the Fibonacci series, stating that the first plate represents 0, the second represents 1, the third represents 1 + 2, the fourth represents 1 + 2 + 3, the fifth represents 1 + 2 + 3 + 5, and so on.8 Note that the only difference between Bartlett’s series and the canonical Fibonacci series is that the latter begins with 1 rather than 0, so Bartlett’s sums will be off by 1 compared to the typical series. In Surface Substitution the number 1 is represented by one red dot; each successive term added to the series is represented by one red dot and the disappearance of the appropriate number of black dots. For example, the number 8 is represented in the sixth plate by one red dot and seven empty grid spaces in a rectangular shape surrounding the red dot.
Bartlett’s notes also identify the coordinates of her one red dot for each number added to the series. For example, the position of the one red dot for the number 8 is given as 33/27, which represents a position in the 33rd column and 27th row of the plate’s 48 by 48 grid. It is unclear from the notes how she obtains the position of the red dot, but curator Brenda Richardson observes that in a group of nine-plated works painted by Bartlett between 1972 and 1974, ‘the positions of the set points were determined by a random drawing of slips numbered 1 through 48. One slip was drawn to set the horizontal row position and one slip was drawn to set the vertical row position.’9 It appears that the location of the red dots in Surface Substitution was selected in a similarly random manner.
By plate number 11, Fibonacci number 89, the white rectangular regions start to overlap. By the sixteenth plate, the grid is white with the exception of 15 red dots. Given that the number of squares in Bartlett’s grid is 48 x 48 = 2304, and Fibonacci numbers 1 to 15 give a total of 1596 while Fibonacci numbers 1 to 16 add up to 2583, it is plate 16 is the first to be completely devoid of black dots. Bartlett then begins the process in reverse, representing the Fibonacci numbers as 1 yellow dot with the remaining dots in black until plate 31, which contains all black dots and 15 yellow dots. In the last row of plates, she blackens 1 of these yellow dots, then 2, 3, 5, then all of them, again according to the Fibonacci series. The final plate returns to the state of the first plate, with all squares occupied by black dots.
The ‘Game of Life’
As well as exploring the Fibonacci series, the progress of the sequence of dots and spaces across the plates in Surface Substitution is reminiscent of mathematician John Horton Conway’s ‘Game of Life’. Devised in 1970, the game is a mathematical schema used to model complex systems that are sensitive to ‘initial conditions’ – the term that refers to the state of the system, its original arrangement of colours and spaces, at the beginning of the game. In the game, one begins with a grid exactly like one of Bartlett’s plates, with any number of cells coloured.10 A series of three or four rules are then specified for how the coloured squares live, propagate or die.

Fig.1
John Horton Conway
‘Game of Life’, one possible initial configuration

Fig.2
John Horton Conway
‘Game of Life’, first iteration for the initial configuration shown in fig.1

Fig.3
John Horton Conway
‘Game of Life’, eleventh iteration for the initial configuration shown in fig.1
In the example given in fig.1, each live (yellow) cell with one or no neighbours dies (becomes grey) and each live cell with four or more neighbours dies, whereas each cell with three neighbours becomes alive (turns yellow). After one application of the rules of survival or death, the configuration has shifted (see fig.2), and the next iteration of the game proceeds from this arrangement, such that by the eleventh iteration, for instance, the configuration has changed substantially (fig.3).
Much like Bartlett’s approach, in the ‘Game of Life’ an algorithm is specified to produce each plate based on the preceding plate. The only difference in Surface Substitution is that Bartlett relies on the randomness of the first coloured dot’s position, rather than the ‘initial conditions’ seen on the first plate, to produce an infinite variety of possible forms.
The visualisation of number
Bartlett’s passion for visualising number echoes the work of many mathematicians. The history of mathematics has proven that such visualisations stimulate mathematical discovery and promote understanding of the subject. For example, René Descartes (1596–1650) invented the Cartesian coordinate system – the x-y system that many of us learn at school that allows us to represent the relationship of points on a plane using pairs of numbers. As we have seen, Bartlett used her own system for representing the positions of dots in terms of column number (counting from left to right) and row number (counting down from the top). It was Descartes’s simple visualisation of number pairs that allowed the creation of calculus and therefore all the modern technology that relies on it. Mathematicians Peter Borwein and Loki Jorgenson have written about the key role visualisation plays in mathematics as follows:
For the non-professional, the idea that mathematicians ‘see’ their ideas may be surprising. However the history of mathematics is marked by many notable developments grounded in the visual. Descartes’ introduction of ‘cartesian’ co-ordinates, for example, is arguably the most important advance in mathematics in the last millennium. It fundamentally reshaped the way mathematicians thought about mathematics, precisely because it allowed them to ‘see’ better mathematically.11
The authors also state that ‘visualization of mathematical structures takes the human mind to places it has never been and shows the mind’s eye images from a realm previously unseen’.12 One example of the power of the visualisation of number can be seen in the number pi (π), which expresses the ratio of a circle’s circumference (distance around the circle) to its diameter (distance across the circle). Pi is not just in every circle, no matter how large or small, but is also necessary in describing cycles, waves and rhythms, such as sound waves, heart rhythms or electromagnetic waves. Like the golden ratio, pi is an irrational number, meaning that the digits of pi continue infinitely with no discernible pattern. In a 2015 article for the New Yorker, mathematician Steven Strogatz stated:
The digits of pi never end and never show a pattern. They go on forever, seemingly at random – except that they can’t possibly be random, because they embody the order inherent in a perfect circle. This tension between order and randomness is one of the most tantalizing aspects of pi.13
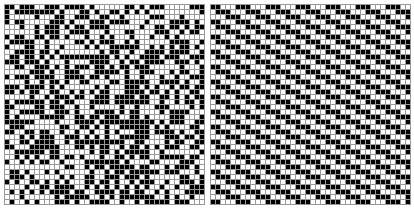
Fig.4
Visualisations of the first 1600 decimal digits of pi (left) and of 22/7 (right)
Wolfram MathWorld
On the other hand, the rational number 22/7, which is often used as an approximation to pi, has a decimal representation of 3.142857142857142857…, with a clear pattern of 142857 that is repeated infinitely. The best way to see this difference between pi and 22/7 is in the two widely used visualisations shown in fig.4. Each cell in the grid represents a digit 0 to 9, with the cell coloured black if the digit is odd and white if the digit is even. In the grid on the left, the first 1600 decimal digits of pi are shown, moving left to right in each row, while in the grid on the right, the first 1600 digits of 22/7 are shown.14 As the two arrangements of black and white squares indicate, there appears to be no pattern to the digits of pi, but a very distinct pattern to the digits of 22/7.

Fig.5
Jennifer Bartlett
1 Dot, 2 Dots 1973
Collection Kate Hoblitzell
Bartlett shows the factor structure of the number 48 in a similar way in her work 1 Dot, 2 Dots 1973 (fig.5). This work consists of nine plates, each representing the numbers 2 to 10, where the first plate is 2 and the ninth plate is 10, and visualises the numbers created when 48 (representing the number of cells in one row) is divided by the plate’s number. The numbers 2, 3, 4, 6 and 8 all evenly divide 48, so the first, second, third, fifth and seventh plates all show columns of dots (a set of black dots and one white dot); but the numbers 5, 7, 9 and 10 do not evenly divide 48 and so the fourth, sixth, eighth and ninth plates produce different patterns. Analysing these latter plates can give meaning to fractions: for example, in the fourth plate, 48 divided by 5 is equal to 9⅗, which can be expressed as nine groups of five squares plus an extra three, so that the remaining two from that group of five must begin the next column.

Fig.6
Jennifer Bartlett
Series VIII (Parabolas) 1971
Walker Art Center, Minneapolis
© Jennifer Bartlett
Bartlett often plays with sequences: in Original Fibonacci 2001 (private collection) she again featured the Fibonacci numbers, while in Equivalents 1970 (private collection) she visualised the sequence 5, 10, 20, 40, 80… in a very structured yet random way, again using the tension between order and randomness that is in the nature of irrational numbers.15 One of her most interesting sequences appears in Series VIII (Parabolas) 1971 (fig.6), another work consisting of thirty-six plates. Bartlett describes Series VIII (Parabolas) as a ‘simple counting piece, six colours in a sequence that builds so that each colour expands its domination, starting always on the upper left-hand corner and reading left to right, and then drop down a line’.16 The artist recalls feeling surprised when the pattern that this produced featured parabolas – symmetrical U-shaped curves – stating: ‘I don’t know why. I understand the visual phenomenon but would not understand the explanation.’17
Parabolas exist in nature as the path taken by any projectile (such as a ball kicked into the air), and are essential in technology in calculating the optimal design of telescopes and satellite dishes. In the first plate of Series VIII (Parabolas) Bartlett has coloured the first six cells of the 48 by 48 grid, moving left to right, then skipped a cell, coloured the next six, skipped two cells, coloured the next six, skipped three cells, coloured the next six, skipped four cells, and so on, continuing to the final cell of the grid. If we number the cells in the plate’s 48 by 48 grid from 0 to 2303, and then place in sequence the numbers of the squares in which each sequence of six colours begins, then we would get:
0, 7, 15, 24, 34, 45, 57…
We can see that each number in this sequence is generated by adding 7, then 8, then 9, then 10, then 11 (and so on) to the previous number. It is this increasing difference between one number and the next that produces the U-shape. Using the x-y system developed by Descartes, the xth number of this type of sequence can be described by a formula, specifically
y = .5 x2 + 6.5 x
So, the fourth number, for example, can be obtained by substituting 4 for x, to get .5 (42) + 6.5(4) = 34.
In Surface Substitution, as in Bartlett’s other pieces, the mathematics is simple but the result is profound; a simple algorithm that can be expressed succinctly in algebraic form produces a complex and potentially infinite structure that evolves from one plate to the next. The artist creates works that embrace both order and randomness, and that inspire questions leading to further mathematical explorations. What if a different sequence were used? What if a different method of placing the sequence were used? What if a different number of colours were used? Indeed, in her notes for Surface Substitution Bartlett states ‘do same system w/diff numerical sequence’, indicating her interest in similar visual experiments, the possibilities of which are seemingly endless.
In an article examining the role of visualisation in mathematics, Miguel de Guzman described how it helps mathematicians ‘acquire what we could call a certain intuition of the abstract’.18 Visualisation in mathematics provides concrete representations of highly abstract ideas and enables exploration of the properties of different concepts as well as the relationships between them. The work of the artist and the work of the mathematician are very similar in this way. Art and mathematics are often considered to be two very different cultures, but in Jennifer Bartlett’s work, these cultures meet.