The index and the diagram are two seemingly incompatible types of sign. While the index has a close, causal or tactile connection with the object it signifies, the diagram is a form of representation that often involves statistical abstraction from phenomena, such as trends in the stock market or the weather. Graphs and diagrams convert statistical data into lines, bars or pie-charts; or translate temporal relations into spatial relations. Some forms of diagrammatic representation, however, are generated directly by their object. For instance, the cardiograph and the seismograph respond to the rate of one’s heart beat and the earth’s tremors, respectively. These beats and tremors are registered on a graph showing variations over time as a spiky line. It is this hybrid form of representation – this indexical diagram – that will henceforth be referred to as a graphic trace. Hybrid, because it takes from the index a registration of something unique – the impress of an individual – while incorporating the diagram’s abstraction from what is immediately given in perception.
Rilke’s primal sound
An essay by the German poet Rainer Maria Rilke, ‘Primal Sound’ (1919), concerns just this sort of conversion of tremors into what he calls ‘another field of sense’.1 He begins by recalling a physics lesson at school, shortly after the phonograph was invented, when the class was instructed to make a primitive recording device that captured and played back the sound of their own voices. The children made a funnel of cardboard that was closed at the small end with some paper through which they stuck a bristle from a brush. This receiver was then put in contact with a cylinder covered in wax that could be rotated with a handle. They spoke into the funnel, causing the paper to vibrate and the needle to incise an irregular fine line in the receptive, rotating surface of the cylinder. This wavy mark in the wax was then fixed with varnish, at which point the students were able to reverse the process, playing back the recording with the needle and listening intently to their voices through the funnel. The effect, wrote Rilke, was staggering: ‘We were confronting, as it were, a new and infinitely delicate point in the texture of reality.’2
But it was not the recorded sound, so much as the graphic marks on the cylinder that indelibly impressed themselves on Rilke’s memory. This became apparent years later when, as an anatomy student in Paris, he cast a glance at a human skull bathed in candle light. In that half-light, the coronal suture became strikingly visible and reminded him of the wavy line scratched on the cylinder of the primitive phonograph. He began to wonder: ‘What if one changed the needle and directed it on its return journey along a tracing which was not derived from the graphic translation of sound, but existed of itself naturally … along the coronal suture, for example.’3 Lines occurring everywhere could be put under the needle and one would be able to hear the sound of any line as it made itself felt, ‘transformed, in another field of sense’. The phonograph, for Rilke, was capable of opening up an audible unconscious, giving access for the first time to the melody of things.
Marey’s graphic method

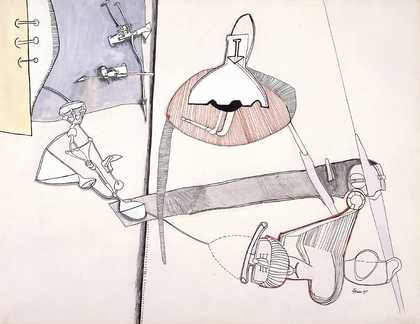
Fig.1
Trace of repeated muscular contractions
From Etienne-Jules Marey, La Méthode graphique dans les sciences expérimentales et principalement en physiologie et en médecine, Paris 1875, p.194.
The phonograph was but one of several inventions of the nineteenth century that received and recorded subtle vibrations and waves; another was the camera. The philosopher Walter Benjamin famously credited photography, and especially the chronophotography of Eadweard Muybridge and Étienne-Jules Marey, with revealing an ‘optical unconscious’, a field otherwise unavailable to visual perception.4 The two pioneers in the field, one of them English, the other French, are often yoked together in discussions of chronophotography as if they were more or less interchangeable. However, their aims and methods were quite different. Before he became interested in photography, Marey spent years developing and improving receiving and recording instruments, which in a clinical setting could trace the small involuntary motions of the body, such as heart beats, blood pressure, respiration rates and so on. He invented, for example, the sphygmograph, a portable gadget that was attached to the wrist to measure the pulse. The motions recorded are barely perceptible, but the sensitive recording instruments he devised and promoted could pick up minute vibrations and transmit them to a stylus that would make a corresponding mark on a rotating cylinder (fig.1). He hailed these machines because they are more sensitive than human perception and because the graphic trace provides a direct language for communicating the information recorded.5 It was a fundamentally new kind of automatic writing that could pick-up, as the media theorist Friedrich Kittler writes, ‘the murmuring and whispering of the unconscious oracles’.6
The image that Marey produced in this way was a single graphic field on which variations over time were displayed. When, in 1878, Marey saw Muybridge’s photographic studies of human and animal locomotion, he recognised photography’s potential for tracking large bodily movements, but also its disadvantages. Muybridge took still photographs in quick succession of a figure in motion. These could be displayed as a series of stills or projected as a short film. Muybridge’s experiments led in the direction of realistic moving pictures, that is, an illusion of movement that mimics what is available to the senses. Marey’s sensibility, however, was more diagrammatic. He wanted to capture the trajectory of the moving body on a single field and tried to do so using a camera. However, the cumulative effect of overlapping photographic exposures tended to obscure the picture. To remedy this problem, Marey devised ways of blinding the camera to all but the most essential movements: he dressed his model in black velvet cloth and attached silver buttons and metallic strips to the joints and limbs and had his subject move in front of a black wall. He referred to this figure as ‘un homme skelette’, a skeleton man. As film theorist Mary Ann Doane notes, Marey moved ‘from graphic method to photographic method only to defamiliarize, de-realize, even de-iconize the photographic’.7 By filtering out excess information, Marey was able to produce a clean graphic trajectory of an action. The result was, like his graphic traces of inner bodily perturbations, something between an index and a diagram. It was also a startlingly beautiful new kind of picture.8
Although he was not aiming at artistic innovation, Marey’s ‘blinding’ of the camera and his spinning disk shutter, which ‘sampled’ phenomena at regular intervals, allowing variations over time to register on a single light-sensitive plate, broke up the temporal unity of the pictorial field. As the authors of The Culture of the Diagram have put it, he ‘deconstructed the tableau-making, perspective-view of the camera’, which was left untouched by Muybridge.9 Some people have argued that this set a precedent for cubism.10 It certainly did for the Italian futurists and for Marcel Duchamp’s explicit adaptation of Marey’s ‘geometric chronophotography’ in his 1912 painting Nude Descending a Staircase (Philadelphia Museum of Art).11 In that work, it is the cascading superimpositions of a skeletal figure, registered at temporal intervals, but represented in the same field, that is captured. The figure is a bride stripped bare of everything but a sort of armature and a graphic trace: ‘une femme skelette’. Equally significant is the way surrealists took up the graphic trace. André Breton may have actually used one of Marey’s apparatuses in a medical capacity during the war. For artists and writers associated with the surrealist movement, the impersonal automatism served as a model to be imitated. This moment has been documented in detail by art historian David Lomas in an important article called ‘“Modest Recording Instruments”: Science, Surrealism and Visuality’.12 Lomas took the phrase in quotation marks from the 1924 ‘Manifesto of Surrealism’, the essay that formally founded the group, in which, in a discussion of the successes and failures of attempts at automatic writing, Breton complained that most writers were too full of pride:
But we, who have made no effort to filter, who in our works have made ourselves into simple receptacles of so many echoes, modest recording instruments who are not mesmerized by the drawings we are making, perhaps we serve an even nobler cause.13
Peirce on the index
One of the terms used in this account of the graphic trace, the index, was developed by the American philosopher Charles Sanders Peirce. As part of a highly complex theory of sign systems, Peirce introduced the tripartite division of signs – the icon, the symbol, and the index – based on their differing means of signification: broadly, the icon depends on similarity, the symbol on convention and the index on some physical or existential connection. However, he made clear the view that all types of signs involve a combination of these three major types.14 Indeed, as film theorist Peter Wollen points out, for Peirce, the ‘perfect sign’ is not pure but an equally balanced hybrid of all three types.15 Peirce had a background, not in theoretical linguistics, but in chemistry and physics and, as a consequence, his theory of signs was not limited to systems of communication, but included all kinds of manifestation that could be taken for signs, including medical symptoms, shadows, sunflowers, oxidation and any involuntary trace of an action or condition. He described the index as the most ‘forceful’ type of sign, in that it establishes an existential or causal link to its referent, directing, focusing and heightening attention. A pointing finger and the demonstrative pronoun ‘this’ are indices of this kind. For Peirce, every index carries with it a shock since, by directing attention, it changes perception and this is always to some extent shocking. While a pointing finger or a shadow are simultaneous with and normally adjacent to their objects, most indexical marks are traces of something that was present in the past.
In her insightful essay, ‘The Indexical and the Concept of Medium Specificity’, Mary Anne Doane observes that there is a tension in Peirce’s writing on the index between, on the one hand, the ‘purest index’, the demonstrative pronouns ‘this’ or ‘that’, which pick out a particular object here and now with the help of a pointing finger, and, on the other hand, the notion of the index as trace.16 Directing attention to an object happens in the present moment and in the presence of the object. The index as trace, however, is produced or caused by actual contact with an object (a footprint in the sand, for example) but the object itself is absent. In this instance, attention is directed to something that was present in the past. As Doane observes: ‘The trace does not evaporate in the moment of its production, but remains as the witness to an anteriority.’17
The art historian Rosalind Krauss discusses both sorts of index in her article ‘Notes on the Index’, first published in 1977, but she emphasises the trace when she considers the American photographer Man Ray and his experiments with camera-less photography. His invention, the rayograph, Krauss notes, is an exemplary case of a type of photography that takes advantage of the indexical, more than the iconic, aspect of the medium. While all photography is indexical, the rayograph ‘forces the issue of the photograph’s existence as an index’.18 She describes the images resulting from putting objects directly onto light sensitive paper as the ‘ghostly traces of departed objects’.19 Man Ray himself put it beautifully when he called the rayograph ‘a residue of an experience … recalling the event more or less clearly, like the undisturbed ashes of an object consumed by flames’.20
Many works by Cuban-born, American artist, Felix Gonzalez-Torres, make use of the character of the index as trace or witness to an anteriority. One such example, “Untitled” 1991, consists of a photograph that was exhibited on large billboard hoardings around New York City (fig.2). The image shows an unmade double bed with two pillows bearing the impression of the heads of those who had recently occupied it. The image is striking because it makes such an intimate domestic scene so public. It is also remarkable for its doubling effect, not only the doubling of identical pillows, but also the doubling of the indexical traces on the pillows by the indexical character of the photograph, making the image a trace of a trace. The all-white picture of recent intimacy is soft and inviting, but it takes on a darker shade once one realises that the date of the photograph, 1991, was the year that Gonzalez-Torres’s partner, Ross Laycock, died of AIDS after a long illness. The billboards functioned, then, as memorials commemorating their loving relationship. This gesture was subtly transgressive in the context of the hysterical reaction to the AIDS epidemic in the United States and conservative attacks on homosexuality. Although the impressions on the pillows are obviously not literal indices of the lovers’ heads, but a staged still-life, this fact does not diminish the power of the work to draw attention to something that existed in the past. Now, in retrospect, the emptiness of the bed recalls that the artist himself died just five years later.21

Fig.2
Felix Gonzalez-Torres
“Untitled” 1991
Printed billboard
© The Felix Gonzalez-Torres Foundation
Gonzales-Torres used the power of the index as trace to refer to past presence and present absence. Yet it is not the sort of artistic use of the index that picks up and records bodily or mental perturbations. A work by Bulgarian artist Nedko Solakov, Fear 2002, exemplifies this capacity of the index (fig.3). An extract from Solakov’s text that forms part of the work makes this clear:
Between July 3rd and September 15th, 2002, I carried small balls of clay in my hands during all the flights I took to various destinations. To transform these balls into works of art was very easy. I just exploited my natural (and acquired) fear of flying and kept squeezing them all the time in my fists. Some of them were held for three hours, some for one. The sophisticated material captured the nervous convulsions of my terrified hands, triggered by all that bumping, babies crying and the moments of relatively quiet cruising (which are the worst because I expect something – For God’s sake No! – to happen every minute).22

Fig.3
Nedko Solakov
Fear 2002–3
Terracotta, Alitalia, Austrian Airlines, and Lufthansa boarding pass stubs, ball-point pen;
ten pairs of sculptures, some of them in pieces; dimensions variable.
Courtesy the artist
Photograph © Angel Tzvetanov
The bodily involuntariness of the clay sculptures is matched by the computerised automaticity of his boarding passes displayed alongside the hand-made pieces. Coincidentally, some of the sculptures look like ears listening anxiously for the plane’s engines to falter.
The diagramatic paradigm
Peirce also discussed the diagram, which he understood as a sub-specie of the icon because there is a relationship of similarity between the logical or temporal relations and spatial relations of the diagram. Following Peirce, the Russian-born semiotician Roman Jakobson explored the use of diagrams in everyday language. For instance, some sentences can be seen as mini-diagrams: Julius Caesar’s famous utterance, ‘Veni, vidi, vici’ (I came, I saw, I conquered), displays in a linear sequence the temporal order of his deeds.23 Pictures also display logical relations diagrammatically, as when the most important figure in a composition is depicted larger and positioned centrally. There is, of course, a measure of custom and convention in this arrangement, but it is not arbitrary; rather, it has an underlying diagrammatic logic. The art historian Meyer Schapiro wrote about these pictorial diagrams, observing the way the space around figures affect one’s sense of them. Referring to work by Edvard Munch, he noted that this is even more evident where several figures are presented, for ‘then the intervals between them produce a rhythm of body and void and determine effects of intimacy, encroachment, and isolation, like the intervals of space in an actual human group’.24
A wide-ranging account of the diagrammatic paradigm as it figures in modern and contemporary art can be found in art historian Benjamin Buchloh’s 2006 essay, ‘Hesse’s Endgame: Facing the Diagram’. During the twentieth century, Buchloh argues, ‘one of the principal dialectical oppositions in the medium of drawing has been the authentic corporeal trace and the externally established matrix’.25 On one side, drawing as desire, on the other, drawing ‘as self-critical subjection to pre-existing formulae’.26 Buchloh singles out Duchamp’s Network of Stoppages 1914 as a pivotal work because Duchamp overlaid a grid and a diagrammatic network of lines on top of a Cézannesque painting of nudes – one form of representation, as it were, displacing another.27 Unlike prior models of drawing, the diagram would not trace desire, call forth corporality or make a liberatory gesture; rather it would register ‘the disenchantment of the world and the total subjection of the body and its representation to legal and administrative control’.28 Buchloh alludes here to Muybridge and Marey, stressing the adoption of their techniques for time and motion studies aimed at disciplining labour. The diagrammatic drawing is, for him, the deliberate evacuation of the body and subjectivity, or at least their disciplining and control. He concludes that Eva Hesse adopted the diagrammatic and subverted its logic, contradicting the regulating pattern of graph paper, for example, by inscribing tiny ink circles in the graph paper squares of Untitled 1967 (private collection). As art historian Briony Fer has observed, it was the variable pressure of her hand making little circular movements that produced the figure of a cross.29 In other words, Hesse and other artists of this period adopt the diagrammatic mode in order to register their sense of the impossibility of any spontaneous, unmediated gesture, while at the same time subtly subverting the coercive regimes of the diagrammatic.
A similar strategy can be found in Gonzalez-Torres’s use of the diagram. In fact, his work “Untitled” (Bloodworks) 1989 (fig.4) is formally very much indebted to Hesse as well as to the work of Russian constructivist Alexander Rodchenko.30 It shows ascending and descending diagonal lines on a pencilled grid. Given the work’s title, the lines have been interpreted as registering the daily count of the immune system’s T-cells that track the effects of the AIDS virus. Thus the pair of images might be said to represent false hope and despair. These spare works also bring to mind an illustration in the philosopher Roland Barthes’s autobiography Roland Barthes by Roland Barthes, in which a medical chart of the sort that is routinely kept at the end of a patient’s hospital bed serves as a kind of non-mimetic portrait of the young tuberculosis sufferer.

Fig.4
Felix Gonzalez-Torres
“Untitled” (Bloodworks) 1989
Graphite, coloured pencil, and tempera on paper
© The Felix Gonzalez-Torres Foundation

Fig.5
Amalia Pica
Venn Diagram (Under the Spotlight) 2011
Spotlights, motion sensors and text
Courtesy the artist and Marc Foxx Gallery, Los Angeles
Photograph © Kiki Triantafyllou
An interesting take on the diagrammatic paradigm was exhibited at the Venice Biennale in 2011. As part of her thematic display devoted to subtle coercions of the classroom, the Argentinean artist Amalia Pica showed a piece called Venn Diagram (Under the Spotlight) 2011 (fig.5). The Venn diagram is a particular kind of mathematical graph that displays logical relations with overlapping circles, the simplest of which has two circles. For example, if one circle denotes creatures that have two feet, and the other one, creatures that can fly, then the overlapping area would designate birds and bats, or any other animals that share the two criteria. Pica’s work consists of two spotlights, one with a red filter and the other with a turquoise one, which are projected onto a wall in the shape of a Venn diagram, the central portion of which is white. The set-up demonstrates both a simple logical schema and an elementary physics lesson on the phenomenon of coloured lights mixing to form white light. In the accompanying caption, Pica outlines the diagram’s logical relations of inclusion and exclusion and notes that during the period of the dictatorship in the 1970s in Argentina, any group activity was closely monitored and Venn diagrams were banned from primary school curricula as they were suspected of encouraging subversive thought. The lights are activated by motion sensors so that if just one person is detected in the room, only one light comes on. ‘It requires movement by one person or a combination of two or more people in the room (a transitory collective) in order to see the intersection of the two lights’.31 The sensors and the subtitle of the work, under the spotlight, ‘refer to monitoring and surveillance of people’.32 The piece is an illustration of the kind of paranoid irrationality characteristic of police states where the coincidence of two or more people in a room constitutes a conspiracy, and a Venn diagram takes on a subversive political colouring.
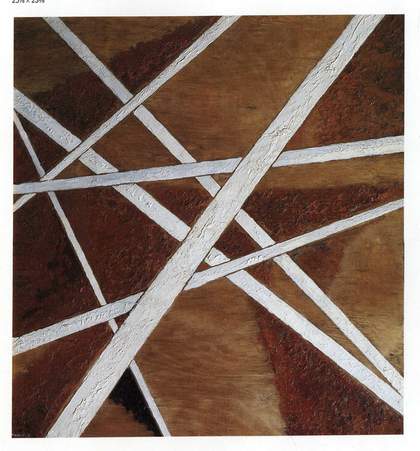
Hesse’s drawings on graph paper, Gonzales-Torres’s Bloodworks series and Pica’s Venn Diagram are examples of diagrams that aim to soften the diagrammatic paradigm’s unyielding abstraction with traces of the body. This accords with what art historian David Joselit argues about Duchamp, who he claims re-invested the domain of the sign – language and the diagrammatic mode – with the carnal and the tactile. If Joselit is right, then Duchamp’s Network of Stoppages represents, not a replacement of one mode by another, but rather a fusion of the diagrammatic and the corporeal, of line and flesh. As Joselit puts it, in ‘Network of Stoppages, the body is subjected to a standard of measurement, but one that collapses back into the carnal’.33 The network is based on the wavy lines Duchamp produced by dropping metre long threads for his 3 Standard Stoppages 1913–14 (fig.6). According to Joselit, this work should be understood as an experiment in giving a light, unruly, curvaceous body to a unit of measurement.34 It would seem, then, that the white threads fixed on dark ground allude, not just to the operation of chance, but to Marey’s graphic trace and, as such, they represent the embodiment of line.

Marcel Duchamp
3 stoppages étalon (3 Standard Stoppages) (1913–14, replica 1964)
Tate
© Succession Marcel Duchamp/ADAGP, Paris and DACS, London 2026
The graphic trace
The graphic trace is a diagram actually generated by the body and as such it combines the carnal and the symbolic, the line and the flesh, effortlessly, automatically. There are two notable examples of artistic appropriations of scientific graphic traces that date from the 1960s, both under the spell of Duchamp. These involve the appropriation of medical technology in order to make unconventional portraits. The first is Robert Morris’s electroencephalographic (EEG) self-portrait, Untitled (Hook, Track, Memory Dents) 1963, which consists of eight lead plaques naming the different areas of the brain monitored by electrodes attached to the artist’s head, and the EEG print-outs recorded at each location. Morris discussed the piece in an interview conducted by art historian Paul Cummings in 1968, noting that during the recording of the EEG, he thought about himself for the time it took the graphic line to equal his height, thereby compounding its reflexivity:
I went to N.Y.U. Medical Center and I had the electroencephalogram made. I wanted to make a self-portrait … In one second the needle will travel so far. So I calculated the time I would have to think about myself for the needle to travel the length of my height. And that was considered a self-portrait. So I thought about myself for this time and used that kind of output as the drawing.35

Fig.7
Brian O’Doherty
Portrait of Marcel Duchamp: Mounted Cardiogram 4/4/66 1966
Electrocardiographic tracings, ink and typewritten text on paper
Courtesy the artist
Morris understood the work to be a non-traditional kind of drawing. As he says later in the interview, ‘each one of those needles makes a little different kind of mark. The paper is very special. There are many lines. There are eight lines I believe from eight parts of the brain. For me it’s interesting to look at’.36 It was shown in the Green Gallery the year it was made along with a number of other pieces that, as Morris comments, ‘related to the body, my body, records of brain waves, photographs of myself, various objects involving recording actions like a hook dropped on plates of lead and drawn through plaster’.37 Morris implicitly makes a connection here between indexical traces of the body and the material traces of process art.
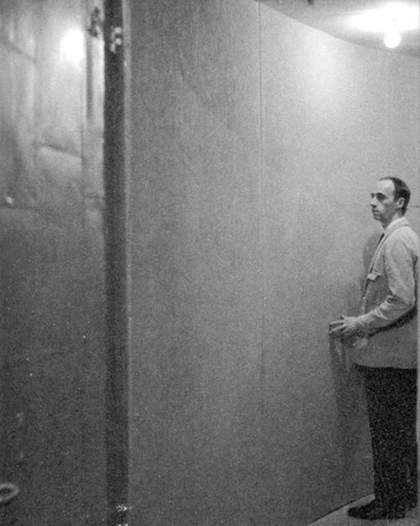
The second work that makes use of a scientific graphic trace is Brian O’Doherty’s Portrait of Marcel Duchamp 1966 (fig.7).38 O’Doherty greatly admired Duchamp and made friends with him in the early 1960s. He was provoked, however, by Duchamp’s pessimistic attitude to the possibility of art surviving its moment of creation. Duchamp saw the museum as a graveyard and contended that, ‘When you put art on the wall of the museum, it begins to die’.39 O’Doherty, who was trained as a doctor and was at that time interested in the ethical issues and problems of identity that arose from the possibility of transplanting hearts (achieved in 1967) and other organs, thought about ways he could refute this sceptical claim. It occurred to him that the perfect refutation would be to capture Duchamp’s beating heart and display it in a museum. He managed to do this by getting Duchamp to lie on a bed and have electrodes attached to his extremities in order to take readings with a hired electrocardiogram (ECG). In order to make the cardiogram live, O’Doherty devised a machine that simulated an oscilloscope in action with the characteristic trace of Duchamp’s endlessly beating, immortal heart. According to O’Doherty, Duchamp suggested signing the piece ‘Brian O’Doherty, MD’, insinuating himself as co-author. However, O’Doherty realised that the piece, far from being collaborative, had undertones of theft and fetishism. O’Doherty’s sense of having challenged Duchamp – and won – is best represented by Duchamp Boxed (fig.8), a cylinder wrapped with a strip of the ECG inserted into a little blue cardboard casket.

Fig.8
Brian O’Doherty
Duchamp Boxed 1968
Electrocardiographic tracing, cardboard box
Courtesy the artist and Galerie Thomas Fischer
The British artist Susan Morris makes prints and tapestries using the latest technologies of the graphic trace. In preparation for an ongoing series of works, Morris constantly wore on her wrist a device called an actiwatch, which records intensity and duration of movement, and is used, for example, by chronobiologists to track sleep disturbances. The actiwatch’s data is fed into a computer to create graphs that display the subject’s periods of waking and sleeping. Morris adapts these multi-coloured displays to show periods of ‘being’ and ‘fading’ over time (fig.9).

Fig.9
Susan Morris
Three Days in Newcastle 2009
Actigraph, archival inkjet on paper
© Susan Morris
As she remarks, ‘the bright colours are the trace of my activity “in the world” and the dark areas (the shadows) are when I’m “out of it”, sleeping and, quite probably, dreaming’.40 What emerges from her practice is what the writer Marcel Proust called the ‘intermittence’ of the self, its memory blanks and involuntary recollections, its fluctuating presence and absence. When Morris was awarded a Wellcome Trust grant in 2010 to make new work for the John Radcliffe Hospital in Oxford, she decided to make large tapestries by inputting data from the actiwatch that had tracked her sleeping and waking patterns over long periods. Her choice of medium was prompted by a reading of Walter Benjamin’s essay ‘The Image of Proust’ (1929), where Benjamin claims that Proust’s involuntary memory actually resembles forgetting. Generalising from this, Benjamin remarks that ‘when we awake each morning we hold in our hands, usually weakly and loosely, but a few fringes of the tapestry of lived life, as loomed for us by forgetting’.41 He inverts the story of patient Penelope who unravelled by night the pattern woven during the day. Rather, Benjamin suggests, it is our purposive activity and remembering that unravels the patterns formed at night.42 This formulation draws on Sigmund Freud’s contention that consciousness and memory are incompatible states.43

Fig.10
Susan Morris
SunDial:NightWatch_Sleep/Wake_2010 2011
Silk and wool yarn tapestry
Installation view at John Radcliffe Hospital, Oxford
© Susan Morris

Fig.11
Gabriel Orozco
Path of Thought 1997
Silver dye bleach print
Courtesy the artist and Marian Goodman Gallery, New York

Fig.12
Gabriel Orozco
Finger Ruler II 1995
Drawing on graph paper
Courtesy the artist and Marian Goodman Gallery, New York

Fig.13
Amalia Pica
Spinning Trajectory #2 2009
Felt-tip on graph paper
Courtesy the artist and Marc Foxx Gallery, Los Angeles
Photograph © Robert Wedemeyer
The team of chronobiologists at the University of Oxford who lent Morris the actiwatches have described sleep patterns as being akin to fingerprints: unique and individual. It is possible, then, to think of this body of work in relation to automatic writing – or drawing – and to consider the graphs as involuntary, diagrammatic, displaced self-portraits. The tapestry SunDial:NightWatch_Sleep/Wake_2010 2011 (fig.10) is one of three permanently installed in the John Radcliffe Hospital. The horizontal axis represents 365 days, while the vertical axis shows variation in activity over the course of the day: each day is 1440 minutes long and there is one thread per minute. This calculation determines the width of the tapestry. What looks like a ‘night sky’ or canyon down the middle of the tapestry represents the low level of activity at night.44 The tapestry is rigorously diagrammatic, yet it is also marked by the intimacy of the index. To the left, one can clearly make out a time-shift registering a trip to New York City and, on the right, a thin blue line crossing the dark canyon that registers an all-night session writing a lecture. Morris’s work evokes the ungovernable body of the hysteric in the nineteenth-century clinic, subjected to measure and confinement. Yet, in both cases, laid across a temporal grid, the graphic trace records a wayward body or, as Morris says, one ‘that goes its own way’.45
Rilke speculated about the sound that would be emitted by playing, like a record, the coronal suture of the skull. But it was the skull as protective shield of the brain and the boundless activity of the mind that really interested him. The erratic suture is a metaphor for the inner workings of the psyche and particularly for the impact of trauma, described by Freud as the laying down of an indelible trace.46 In his ‘Eighth Duino Elegy’ (1923), Rilke described the first panicky flight of a young bird: it ‘jerks though the air, as a crack goes through a cup. As the track of a bat tears through the porcelain of evening’.47 The line of flight traces a jagged path through the sky, figured here as a ceramic cup, registering distress in a form similar to the cardiograph or encephalograph. Gabriel Orozco may have alluded to this chain of associations in his photograph, Path of Thought 1997 (fig.11). For this, he drew a graph-like grid around a skull and, using chiaroscuro effects, highlighted the path of the coronal suture. He must have been aware that this image resembles a print-out from some sensitive recording instrument. His Finger Ruler II 1995 (fig.12), which shows the regular intrusion of his finger tips into repeated ruled lines, closely resembles a plate from Marey’s book La Méthode graphique (1878). In Orozco’s drawing and Marey’s graphic trace, bodily perturbations are registered on a grid that seeks to measure and fix them.
Orozco’s simple drawing encapsulates the theme of this essay: it implies that Marey’s significance has nothing to do with the impression of movement, but rather with the invention of a kind of involuntary, bodily language of drawing. Also, while the ruled lines allude, as Buchloh would say, to the way that lives are regulated or pre-programmed by an external matrix, the bumps point to the body’s insistent presence and the subject’s desire to deviate from the straight line. Although the graphic trace was originally a scientific invention aimed at accurately measuring and recording inner and outer bodily motions and can serve as a technique of power and control, there is nonetheless a formal tension between the jagged, irregularity of the line and the grid of the graph paper onto which it is often drawn. This tension is the theme of Amalia Pica’s series of drawings, Spinning Trajectories 2009, which are made on graph paper with a felt-tipped spinning top (fig.13). The top leaves, not a jagged line registering trauma, but rather a skidding, twirling, irrepressible, playful line running across the page.